Last updated on April 27th, 2024 at 10:22 am
Hi Everyone! This blog post is about using Power BI filters in Power BI Desktop. There are two main ways in Power BI to filter data in reports: one way is through Power BI slicers and the other is with Power BI filters. Power BI filters help you to refine data at the visual, report and page level. In today’s post, I talk about page level filters, but later on, I will briefly tell you about the other filter types.
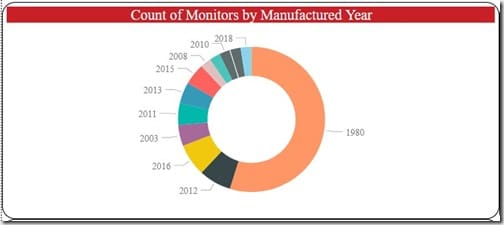
I was working on a computer monitor Power BI dashboard in Enhansoft Reporting. On the home page, in the top left corner, a donut chart (visual) displayed all of the years and a count of the number of monitors manufactured for each specific year. I wanted the data to start from the year 2000. So the task at hand was to only show monitors manufactured between a range of years, 2000 to the present.
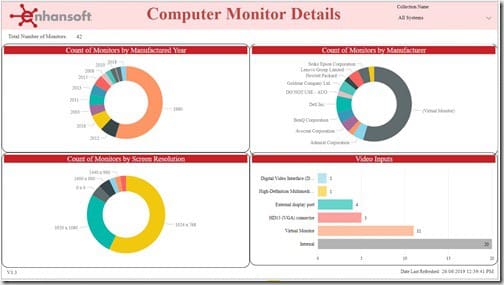
As I mentioned before, there are many ways Power BI lets you refine data. But for this particular task, I decided to use the page level filters. Why? I wanted all of the visuals, on this specific page, to use the same date range.
Page Level Power BI Filters
Once I filter the Year data at the page level, I am assured that each donut chart displays its details from the same date range. By the way, all of the visuals on this page are interactive.
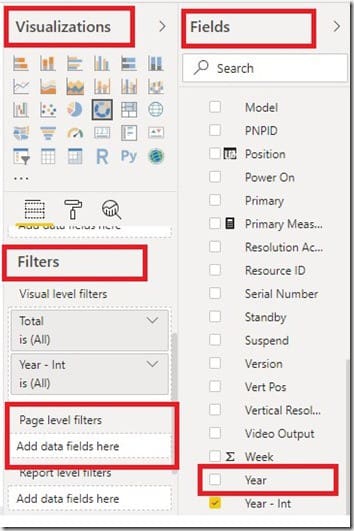
Power BI offers user-friendly filters located on the right-hand side of the canvas under the Visualizations pane. In this example, there is a column in the dataset table with just the manufactured year information. Depending on your needs, you could instead have a data column with the year/month/day or date and time information, etc.
I start by dragging the Year column from the Fields pane to the Page level filters box under the Visualizations pane, as shown above.
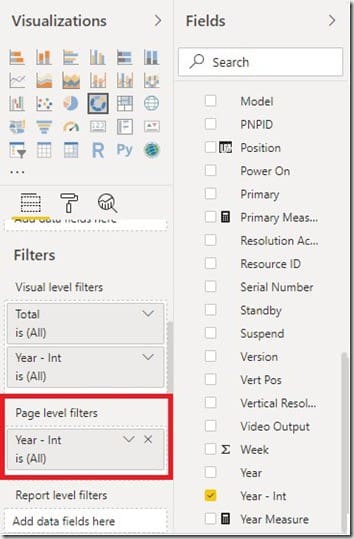
Next, I click on the down arrow next to the x mark in the Page level filters box. Doing so, displays a drop-down list of all the filtering options under that section.
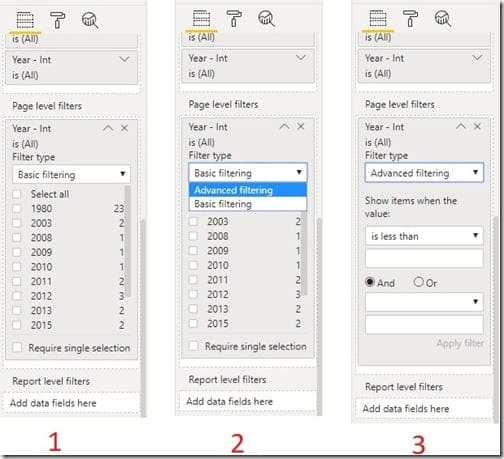
Once the column is in Page level filters, and you clicked on the down arrow. By default, Power BI displays Basic filtering (see image 1).
Click on the down arrow next to it for another drop-down menu (see image 2).
I chose Advanced filtering, and you can see in image 3 that the filter options changed to advanced options.
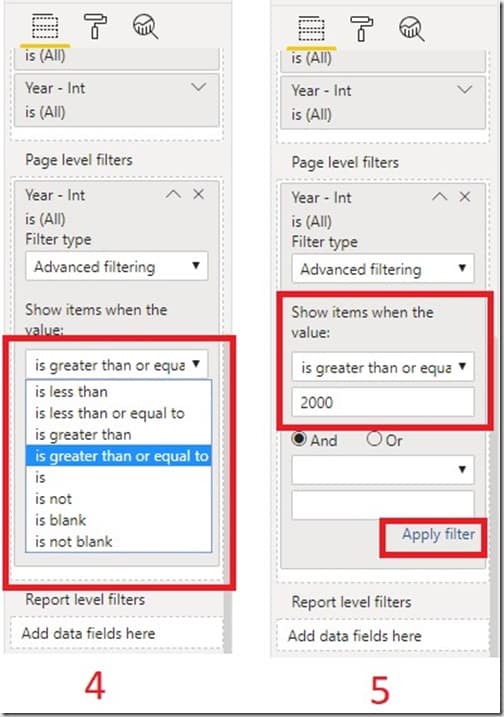
Next, I chose to display data which is greater than or equal to year 2000 (see image 4).
Once the selection was made, I clicked on Apply filter (see image 5).
Note: You can leave the details in the “And Or” section blank (see image 5 between 2000 and Apply filter). If there is no other information to filter, similar to what I did in this example.
Results
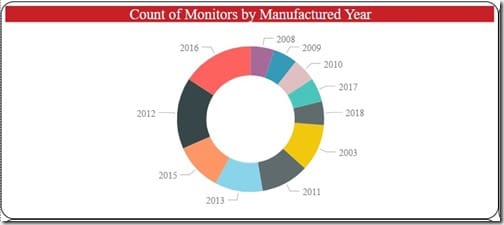
After clicking on Apply filter, the visual automatically adjusts to the changes you made. You can see in the image above that chart now only displays information from the year 2000. The other visuals on the page also adjust once the new filter rule goes into effect.
Similarly, you can use these filters to refine any kind of data while building reports.
Different Level Power BI Filters
Here’s a brief note about the different types of Power BI filters. As you can see, there is something for just about every instance you may need.
- Page Level Filters: Any data filtered under this section is applied to all the visuals on a page.
- Report Level Filters: Data filtered under this section is applied to all the visuals across all the pages in the report.
- Visual Level Filters: Data filtered under this section is applied to a specific visual on a page.
Conclusion
Power BI filters configure data precisely (and easily) at any given level (page, report or visual). This gives you a lot of flexibility when it comes to refining information. Hope you guys find this info useful. What filtering ideas have you come up with for your reports? Finally, don’t forget that you can subscribe to my RRS feed to stay on top of the latest trips and tricks. Additionally, If you have any questions, please feel free to touch base @Garthmj.
