
So, I was talking to a friend that was using the ConfigMgr Client Health Reports and they provided some feedback. That feedback was “It would be great if you could highlight which Devices are in which state”. I said that you can user Power BI Conditional Formatting for that. They asked how can you do that?
So I’m writing this after releases the “Navigating Intune Reporting: Elevate Your Reporting Skills With Power BI” (Grab your copy now) eBook. I thought this would make a good addition to the eBook but before I do that I will make it into the blog. So, this blog will be slight different than other blogs as not only will I show you the steps and create a video. But I will also create it in a Hand on Lab style that will go into volume 2 of the eBook. You get it first!
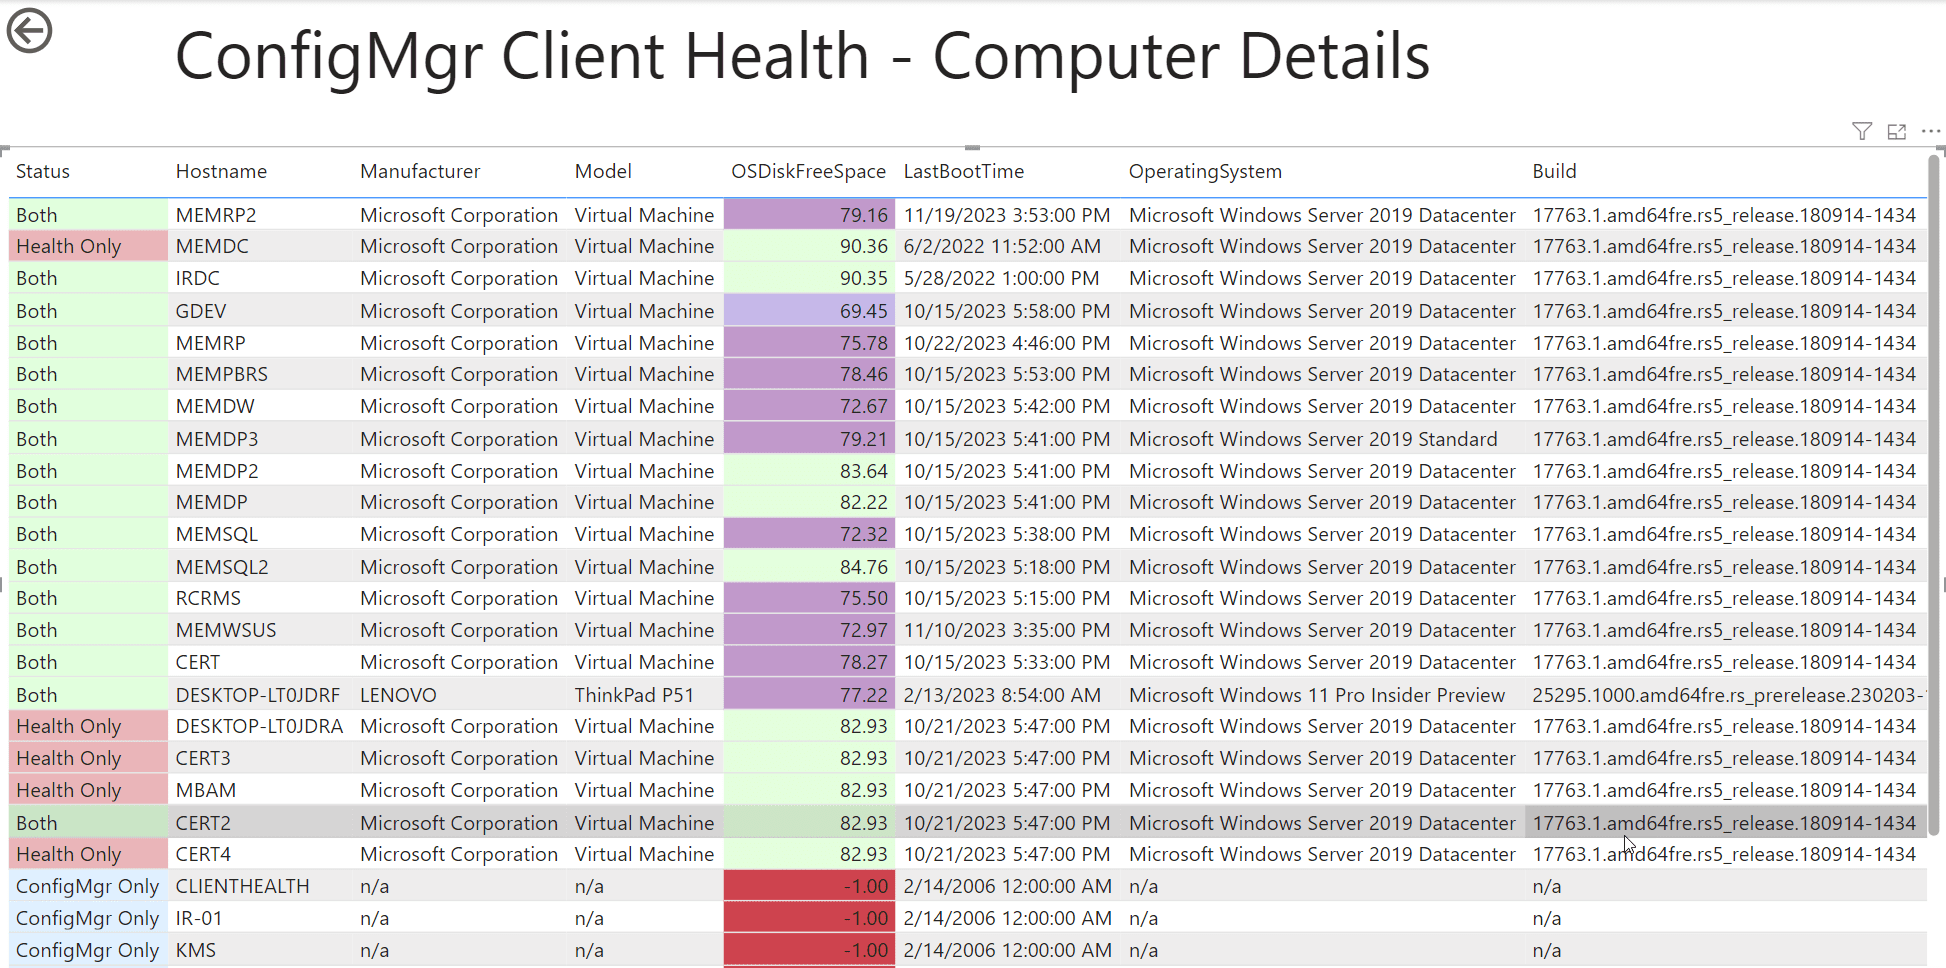
For this example, I will extend the ConfigMgr Client Health – Computer Details page and add color coding to the Status column. Green for Both environments, blue for ConfigMgr Only and red for Health Only.
Power BI Conditional Formatting Lab – Text
In this lab you will change the background color for a given text within a column. Before starting you will require the Power BI reports for ConfigMgr Client Health Reports. Otherwise, you will have to extrapolate the steps for your report. I encourage you to use your own report.
Instructions | Screenshot (if applicable) | |
1 | Open the ConfigMgr Client Health report with Power BI and navigate to the Computer Details | |
2 | Within the Visualizations section, under the columns, select the Status column. Click the popup menu (carrot) | 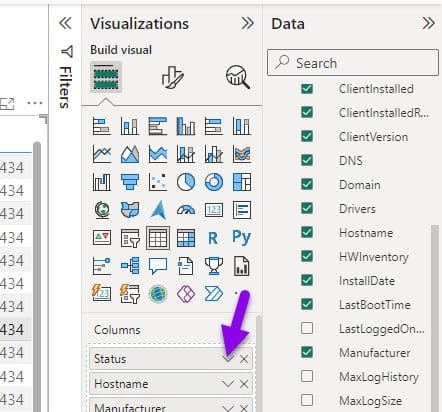
|
3 | In the popup menu, point to Conditional formatting then Click Background color. | |
4 | In the first text box, replace the “text” with the real condition text that you want set a background color for. In this example we want Both. It is important to note that case matters. | 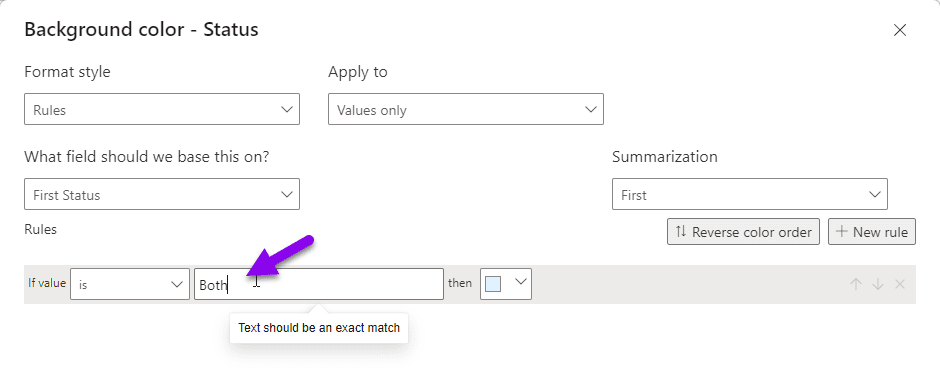
|
5 | Select the color drop down, Select More colors… | 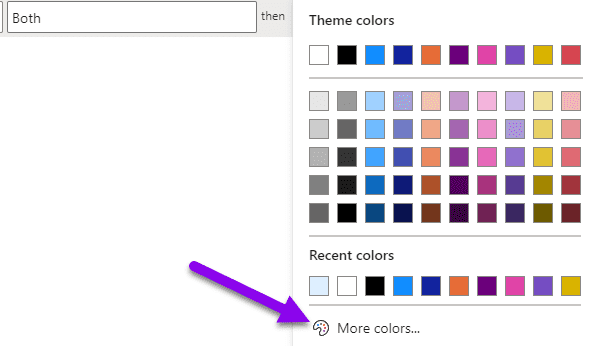
|
6 | Select a light green for the background. Then click OK to return to the rules page. | |
7 | Click New rule in its text box enter Health Only. Next color drop down, this time select the light red. Finally click OK to return to the rules page. | |
8 | Again, click New rule in its text box enter ConfigMgr Only. The color drop down default is a light blue. Leave it as is or adjust as needed. Your rules should look similar to the following. Click OK to complete this section. | 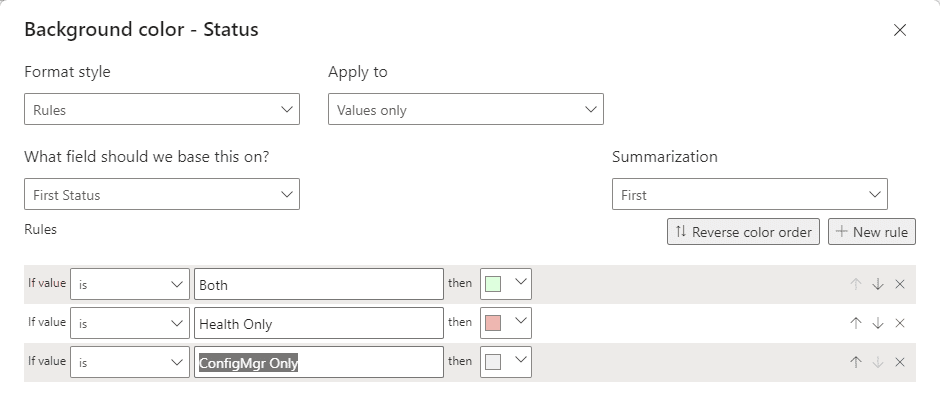
|
9 | Upon returning to the report page your results should look similar to the following. | 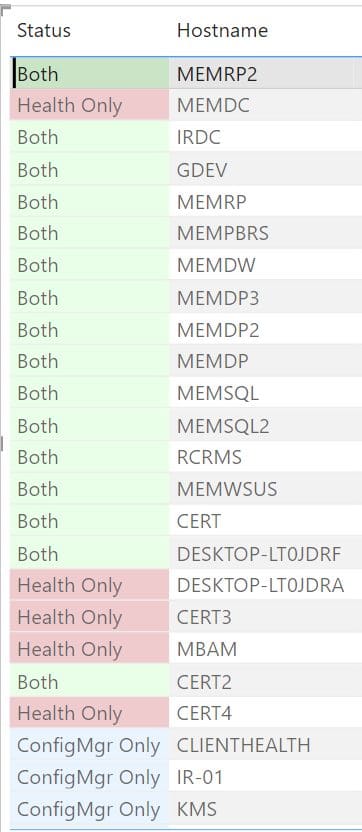
|
Power BI Conditional Formatting Lab – Values
In this lab you will change the background color for a given value within a column. Again, you will require the ConfigMgr Client Health Reports. Otherwise, you will have to extrapolate the steps for your report. I encourage you to use your own report as it is a great way to learn.
Instructions | Screenshot (if applicable) | |
1 | Open the ConfigMgr Client Health report with Power BI and navigate to the Computer Details | |
2 | We will add the OSDiskFreeSpace to the report next to the Model column. Expand Query1 and locate OSDiskFreeSpace Select and drag it to the Columns section, just below the Model column. | 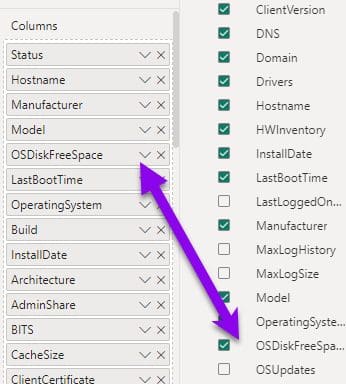
|
3 | Click the popup (carrot) menu next to OSDiskFreeSpace. In the popup menu, point to Conditional formatting then Click Background color. | |
4 | Change the Format style to Rules. | |
5 | Change the Summarization to Sum. | |
6 | Within the First rule adjust value boxes to -9999 and number before change the color to light red as you did with the previous lab. At this point your rules pages will look similar to the screenshot. | 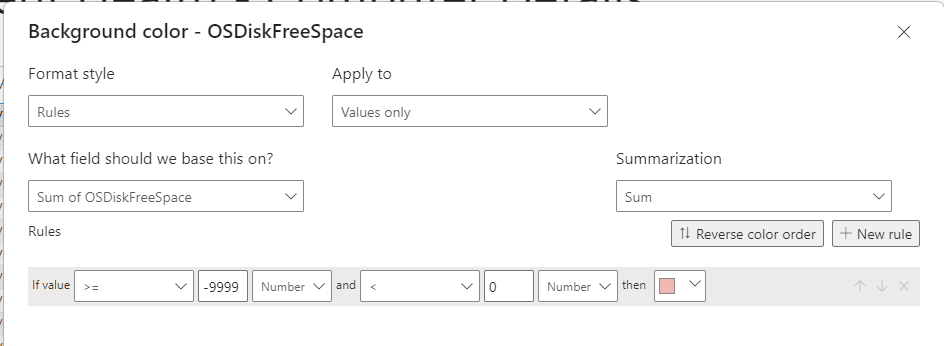
|
7 | Click New rule. Repeat the process for 0 to 40 with a Yellow. Then again with 40-60 with Blue. | |
8 | Repeat the process with 60-70, 70-80, 80-90, 90-9000, each with its own color. When complete your rules will look similar to the screenshot. Click OK to complete the process. | 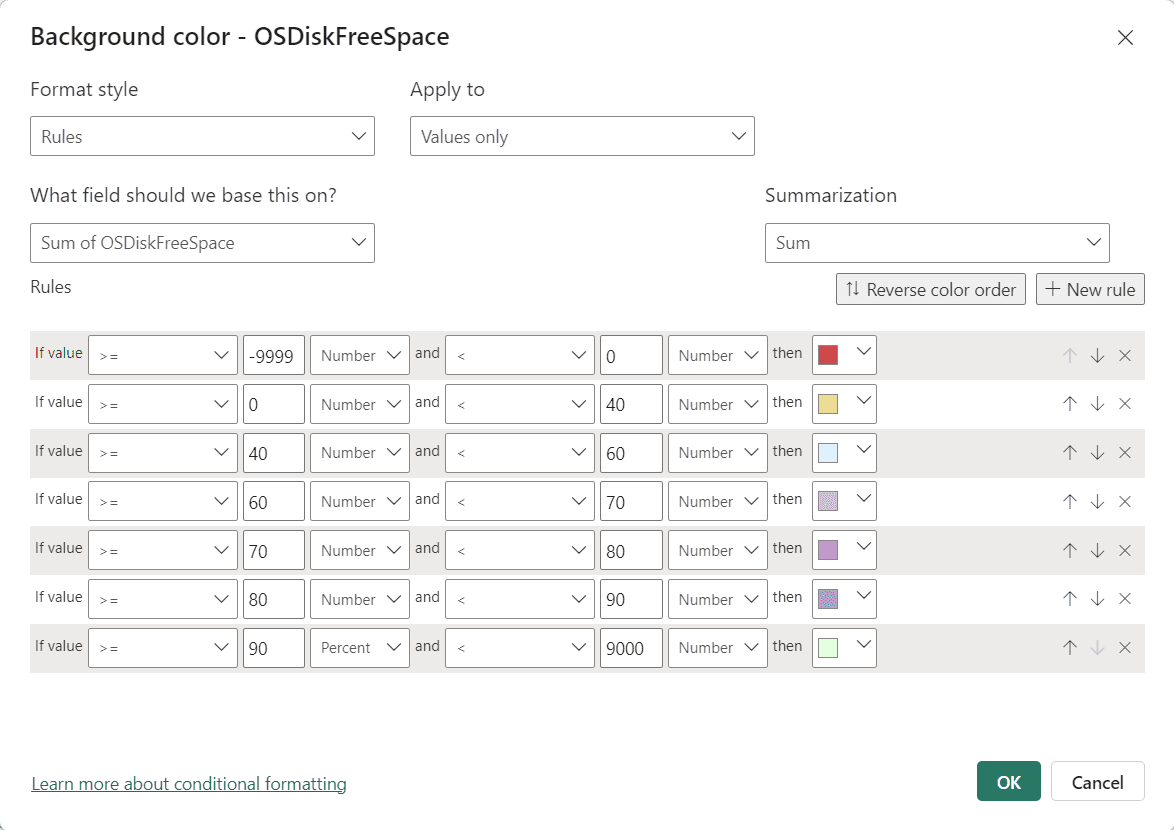
|
9 | Your completed report will look similar to the opening screenshot. | |
Power BI Conditional Formatting Video
This is the first Hands on Lab style blog that I have posted. Did it work? Let me know. Again, If you have any questions about Power BI Conditional Formatting Hands on Lab. Please feel free to contact me @GarthMJ Please also subscribe to my YouTube channel and newsletter.