Last updated on April 27th, 2024 at 10:33 am
In my last blog post, Getting Started with Power BI Desktop and SCCM, I showed you how to create a very basic Power BI dashboard by adding a table to the canvas. But in this post I’ll show you how to add a calculated column to a Power BI table. Ultimately this particular calculated column will be used within a chart, but I’ll talk about that more in my next blog post.
Keep in mind that the steps I’ll be showing in this post can be used for any number of items that need to be calculated. This can include calculating the age of computers or determining how long ago a software title was last used.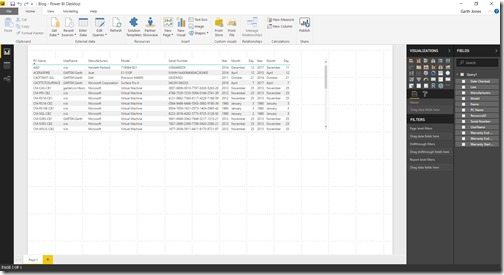
In my last post I started designing a Power BI dashboard about computer ages by adding a table. As I have said, this is what the Power BI canvas looked like at the end of that post.
Adding the Calculated Column to the Query
Before adding a chart to the dashboard, I first needed to determine the age of a computer. Luckily I had the warranty start dates for all of my computers, so I could figure out their ages by using the following formula.
Today’s Date – Warranty Date = Age of the Computer
I could either modify my existing SQL Server query or I could update the query within Power BI. Normally I would modify my existing SQL Server query, but you may not have that kind of time or option, so I’ll show you what I did within Power BI.
The first two things that I needed to consider were:
-How do you get today’s date?
-How do you calculate the difference between two dates?
In order to get today’s date I simply used the Power BI function called: NOW()
Afterward, I found that DateDiff() is the function for calculating the difference between two dates.
Note: DateDiff within Power BI has a different order for the parameters compared to its SQL Server equivalent.
The DateDiff function takes three parameters:
-Start Date
-End Date
-Time Frame (Days, Months, Years, etc.)
This makes the equation to determine a computer’s age as follows:
DATEDIFF(Query1[Warranty Start Date],NOW(),YEAR)
Now that the equation is ready, changes to the query can be made within Power BI.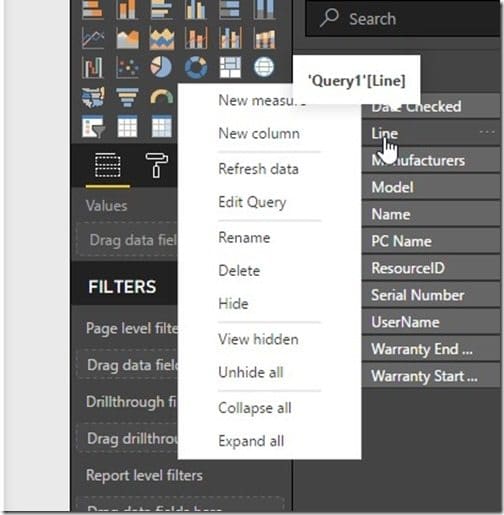
Correspondingly, on the right-hand side of the canvas, select Query1, right-click on it and select New column.
It might not be obvious, but a new equation area opens up (see the purple arrow). I’m not sure what the, “official,” term for it is, but for now I will call it the, “new equation area.” I’m sure someone will tell (correct) me! 😉
Notice that the default name of the Column is Column and because I want the column to be called, “Age,” I’ll change the column’s name too.
The final text will look as follows:
Age = DATEDIFF(Query1[Warranty Start Date],NOW(),YEAR)
As has been noted, notice that the column name changed within Query1!
Adding a Calculated Column to the Table
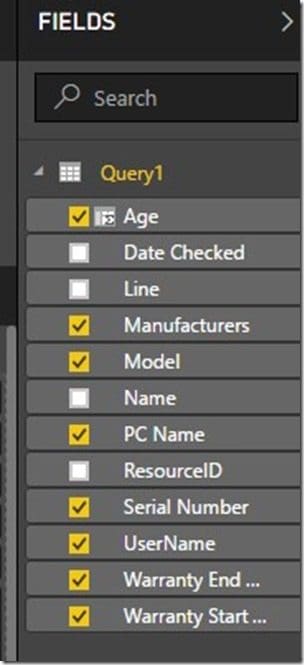
This is the fun part! Select the table and then select the Age column within Query1.
In real-time the Age column is added to the table, but a Total row is also added. Now take a look at the Age value! There is no way that a computer purchased in 2014 is 12 years old in 2017! What is happening? The answer is that Power BI is trying to be helpful. How can you undo this, “helpfulness?”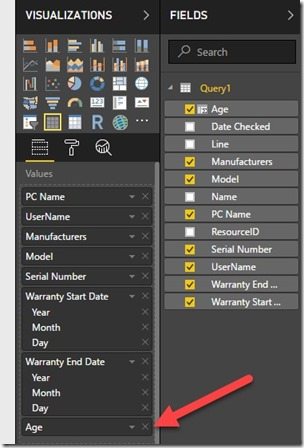
Select Age within the Values area.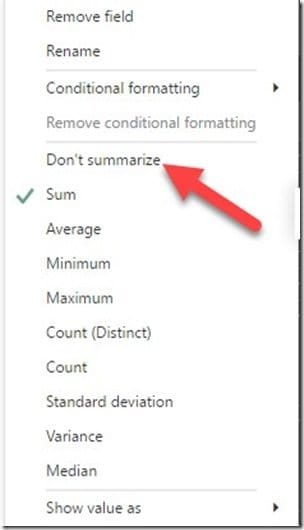
As you can seen, that by default Power BI will Sum this column for you. Simply change the option to Don’t Summarize and you’re done!
Again in real-time, the table updates and the age values make sense. Okay, I hear what you’re saying, so ignore the age values of my Virtual Machines (VMs)! Instead, look only at the age of the first four physical computers.
Summary
Basically, You can use the calculated column feature in a number of ways, as I mentioned at the beginning of this post. For example, you could use it to calculate the percentage of free C:\ disk space OR the number of days since Word.exe was last used. The possibilities are endless!
Consequently, this completes the next step in our mission to create the ultimate Power BI dashboard using SCCM SQL Server data as your data source.
Additionally, I promise that in the next blog post I’ll show you how to add a chart to your dashboard. I’ll talk about how to apply colors to your dashboard in the post after that one. As I often say, “The foundation needs to be built first before adding all of the extras!”
If you have questions, please feel free to contact me @GarthMJ.
