Last updated on April 27th, 2024 at 09:38 am
Hi Everyone! In this blog post, I am going to talk more about the differences between a Power BI slicer and a filter. Before reading what I have to say in this post, I hope you had a chance to see the other posts on Enhansoft’s blog site about the different types of slicers and filters. These posts give you a good idea about each one’s functionality and how they operate in reports. Today, I am elaborating on their differences and giving you more examples about how these features operate on a report, so keep reading!
The Differences Between a Power BI Slicer and a Filter
Both slicers and filters refine query results, but the main difference is that a slicer operates on-canvas, whereas, filters are configured and operate in the background of reports.
In this example, I am using Enhansoft Reporting’s Computer Monitors Power BI report set to explain the differences between these features.
Slicers
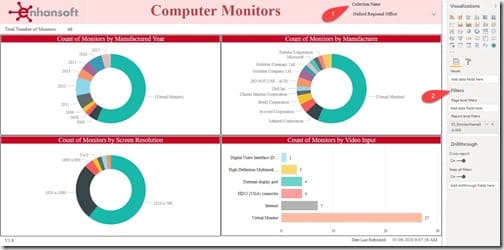
First, I am looking at slicers. Slicers are very user-friendly. You can refine data simply by adding a column to the slicer. An end-user chooses from a set list by using the dropdown feature. In this example, I’m slicing the data (refining the results) by collection name.

In the above image, the location of the slicer (1) and filters (2) are marked on the report. The slicer is on the canvas and is a dynamic and interactive feature, whereas, filters (2) are static, hidden and working in the background.
The objective of this report page is to refine the charts for a particular collection name and arrange them in an orderly manner under their respective sections.
The end-user simply clicks on the dropdown menu, checks out all of the collections and chooses the most relevant option from the list. In this case it’s the Oxford Regional Office.
What I want you to notice in the screenshot above is that there is NO page level filter (2) and the slicer is set to the Oxford Regional Office collection. In the top left corner, you can see that there are 46 monitors. Now, let’s replicate the same outcome using filters.
Filters
The purpose of a Power BI filter is to allow report developers to configure visuals before they are presented to the end-user. Now, I am looking at the filters on the same page and I am going to show you how the filter was setup.

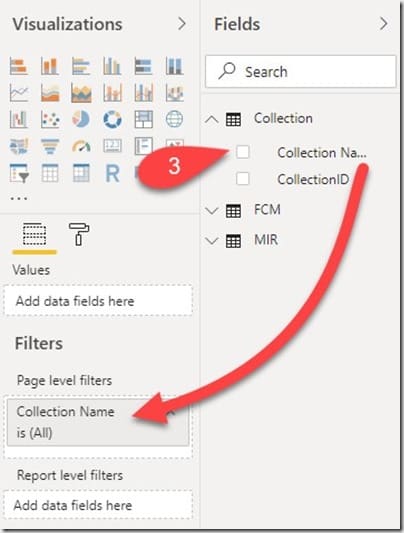
I am also using the same Collection Name column in this example. This shows you that no matter what filtering option the report developer employs, the results remain unchanged. In the above image, I drag the Collection Name (3) column to the Page level filters section.

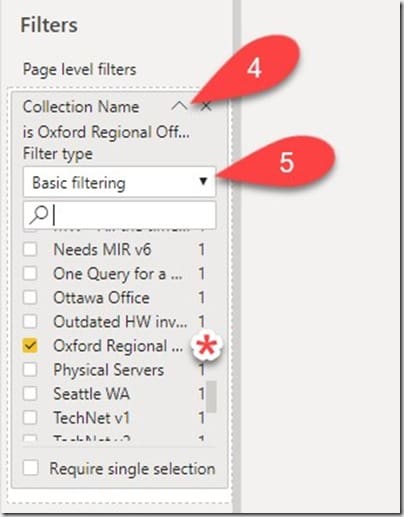
Next, I click on the arrow under Page level filters (4). Then click on the down arrow (5) keeping the filter type to Basic filtering. Finally, I select the Oxford Regional Office collection name and the page updates instantly.

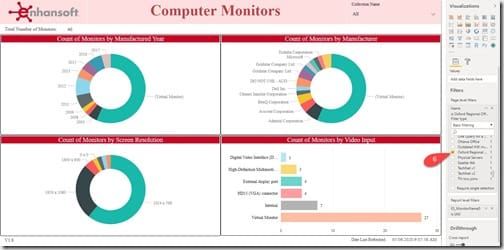
The above image shows the results from the filter (6). Now notice that I reset the slicer to remove it’s filtering so it shows the All collection. This leaves only the page level filter in place. Notice how the results are exactly the same whether or not I’m using the slicer or the page level filter?
Advantages
As I mentioned earlier, the main difference between a Power BI slicer and a filter is that a slicer is an on-canvas, dynamic feature. Whereas, a filter (page level in this case) is a hidden, static feature. Furthermore, a filter can refine an entire report, just a page or simply a visual on the canvas. IMO, there are more advantages to using a filter than a slicer. Below, I put together a couple of lists that note the advantages of each one.
Advantages of Using a Filter
– It can be applied on different levels: Report, Page and Visual.
– A filter can be applied to a specific object on the page, such as tables, charts or cards.
– It can be applied between pages of the same report.
– A filter can be used to reference objects across other reports.
Advantages of Using a Slicer
– A slicer is user friendly; they are displayed on the canvas.
– Report users can pick and choose what they want displayed in the visuals.
– Even though slicers are restricted to a report page, you can add slicers to several pages and synchronize their actions across those same pages.
Should you use a slicer or a filter? There aren’t any wrong answers to this question. They both have their advantages, BUT keep in mind that sometimes slicers and filters conflict with one another. That’s another interesting topic. So at some point, I am going to write a blog post about why this happens. And what the solution is to this problem.
Conclusion
Refining Power BI data results is an art form. Report developers must use their expertise in order to get the most out of reports. They must allow for the right amount of end-user accessibility through slicers. They must manage report performance through different filters. I hope y’all find this helpful. For any questions about the differences between a Power BI slicer and a filter you can reach out to me on Twitter @SuaresLeonard. Till then, good luck.
