Last updated on April 27th, 2024 at 10:20 am
Hi Everyone! Originally, I wanted to use the Power BI parameters feature to display report version numbers in all of my reports. In the end, however, I found another easy way to show this information. Here’s what I did: I created a table and within one of the columns I added a hardcoded value. Next, I used that value in a card. In order to display the card on every report page, I then created a “footer” area near the bottom of the page and inserted the card. Problem solved! In this post, I show you exactly how I did it.
Luckily, Power BI simplifies the task of creating tables for you, so see my step-by-step guide below. By the way, in case you want to learn more about Power BI parameters, here’s a link to another of my blog posts, “How to Create Power BI Parameters.”
Creating a Table for Version Number Information
This is what I am going to show you how to do in this section: first, create a table and name it, “Version Number.” Next, within the table, create a column and enter the hardcoded value for the version number.

From the main page click on the Home ribbon and then click on Edit Queries. A separate window opens up.
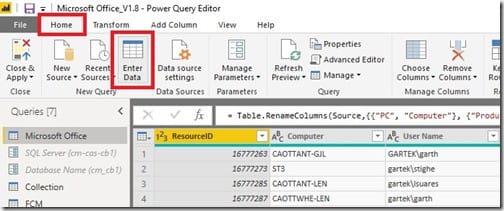
In the new window, click on the Home ribbon, again, but this time click on the Enter Data option.
In this example, I am creating a table with just one row and one column (1×1) of data. By the way, I am using the same name for the table’s name and the column’s name.
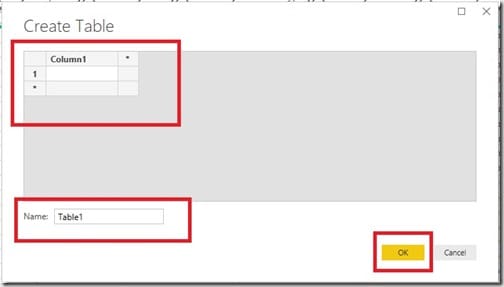
Above is what the Create Table window looks like before I start changing everything.
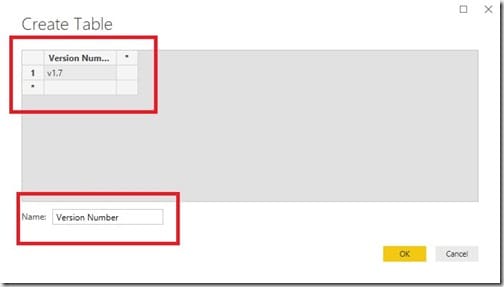
In the Create Table window, edit the column name by double-clicking on Column1 and entering the text, Version Number. Next, double-click on the cell next to the number 1 (under the new text, Version Number) and enter the version information. In my case it is v1.7 and that’s my hardcoded version number.
The next step is to enter the table name. I’m using the same name as the column’s name, so I type Version Number again in the Name text box. Click on the OK button in order to complete this task and close the Create Table window.
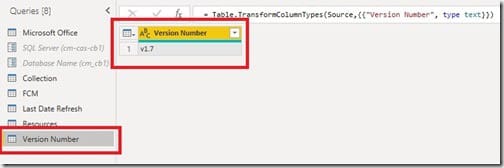
The newly created table, Version Number, is shown under the Queries pane. On the upper right-hand side, you can see my hardcoded value, v1.7, listed within the column (see above).
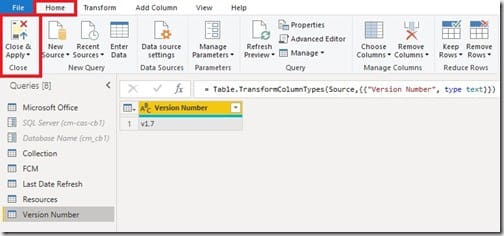
I like the way it looks, so I save it by clicking on the Home ribbon and then selecting Close & Apply.
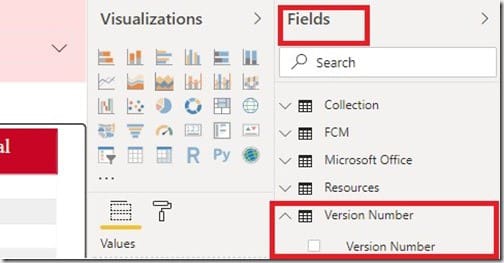
Back on the main page of the report, I find my table on the right-hand side under the Fields pane. When expanded, you can also see the column I created within the table.
Creating a Card for Version Number Information
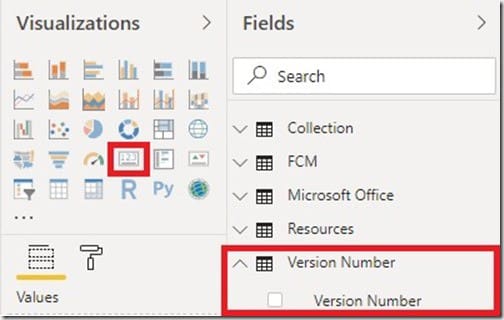
From the Visualizations pane, I click on the Card icon and select the Version Number column from the Version Number table.
The Card automatically displays the version number because of the hardcoded value.
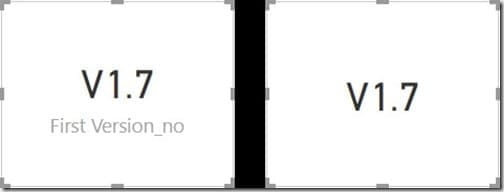
Above (left card), is what my Card looks like once the data is displayed in it when using the default settings. In order to customize the card, according to the planned design (right card), I turned off the category label from the Format tab under the Visualizations pane (steps not shown).

I also wanted the card to look proportionate on every page, so I changed its dimensions by editing the fonts, and sizing it for the best fit. Once this was done, I simply copied and pasted the configured card on each page to the same location to keep it consistent.
Conclusion
I initially intended to use the Power BI parameters feature in order to accomplish this task, but instead, I found it more effective to create a table and to use a card in order to display the version number. That’s the great thing about Power BI. It gives report developers the flexibility to accomplish any task at hand in the simplest and most effective way.
Hope you guys also come up with better ideas to get the job done. If you have any questions regarding Power BI, feel free to reach out to me on Twitter @SuaresLeonard.
