Last updated on July 24th, 2022 at 04:25 pm
The title of this post, “Holy cow, 4.5 million extra rows…! Wow,” is a quote from Alexander Phu when we were discussing the differences between Power BI and SSRS for ConfigMgr reporting. In my last blog post, I talked about how the SQL Server Team believes that Power BI is NOT a replacement for SSRS. Let me explain to you why I agree with the SQL Server Team, particularly when it comes to ConfigMgr.
What’s the problem with Power BI?
Power BI doesn’t allow you to use variables within its queries. Why is that important? Well, the short answer is: you might get 4.5 million rows of extra information from your query. Especially when it comes to the amount of unfiltered data you get with Power BI reporting. Instead of using variables, with Power BI queries you have to either hardcode a dataset or grab the whole dataset and filter the results.
Here’s what this means:
1. You are querying many more rows of data when you use Power BI instead of SSRS.
2. Report processing for Power BI is performed on the desktop, so you will need to download all of your data to the desktop via the network. A significant amount of network traffic/data could be downloaded, so it might be a bad idea to perform these queries via a WAN connection.
Comparing SSRS and Power BI
I’ll demonstrate the difference by comparing the results for a typical software reporting request using both SSRS and Power BI.
- What are the totals of each software title?
- Who has Visio installed?
- What other software is installed on that computer?
These requests translate to the SQL equivalent of three distinct types of queries. So I’ll use queries to produce three different reports: Count, List and Details.
I’m going to use the results from my small lab of 29 computers to extrapolate what you would get for a mid-sized 25,000 computer environment; I’ll go into more detail about that below.
SSRS Query

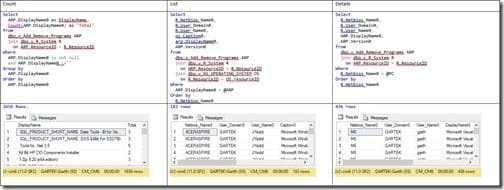
Let’s take a look at how the numbers break down for a SSRS report. Above is the SSRS query for each report.
Count Report
This is a straight-up query, so you wouldn’t use a variable. As a result there will be no difference between SSRS and Power BI. Both will have ~1656 rows of data as shown within my 29 computer lab.
There will likely be a few more rows in the 25,000 computer environment compared to the 29 computers in my lab. But with respect to SSRS vs Power BI, it will be exactly the same number of rows.
List Report
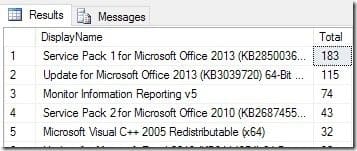
Next, we want to see a list report showing all of the computers that have a particular software title. I’ll use the application with the most installs as shown in the Count query below.

From the results we can see that Service Pack 1 for Microsoft Office 2013 (KB2850036) 64-Bit Edition is the application with the most installs: 183 on 29 computers.
How many rows would there be for 25,000 computers? (25,000 computers /29 computers) * 183 Add/Remove Program (ARP) rows in a 29 computer environment = 157,758 ARP rows in the 25,000 computer environment.
Details Report
See in the screenshot below the minimum, average, and maximum Add/Remove Program (ARP) entries for a computer within the details report. This allows us to know what the range of ARP entries is for an average computer. These numbers are for my lab, but you should see similar results within a 25,000 computer environment.

Power BI Query

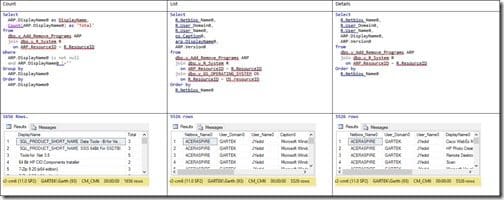
Above is the Power BI query for the three reports. Since Power BI does not allow you to use variables you should expect to see more rows/results that will need to be filtered before being displayed.
Count Report
As I explained above, there will be no difference between the SSRS query results and Power BI query results for this type of report. Both will have 1656 rows of data and as such there is no difference between Power BI and SSRS.
List Report
Since there is no variable to filter the results within this query. The Power BI list query will need to return all ARP entries to the Power BI desktop before being filtered. For 25,000 computers, this will result in (5526/29) *25,000= 4,763,793 rows of data being returned before it is filtered on Power BI desktop to 157,758 rows which are actually needed within the report.
Details Report
Again, since there is no variable within the Power BI version of the details query to filter the results. This Power BI query will require all ARP entries to be returned to the Power BI desktop before it is finally filtered down to 189 rows (average #). This results in (5526/29) *25,000= 4,763,793 rows of data being returned via the network before Power BI desktop can filter the results.
Comparison
You can quickly see from the table below that the Power BI queries returned significantly more data. Verse what is used within the SSRS report/dashboard. For both the List and Details reports you will get about 4.5+ million extra rows of data. This is of course when you are user Power BI. Compared to SSRS queries for 25,000 computers.

Try it for yourself! As a bonus, I have attached a sample SSRS RDL and Power BI dashboard. You can use them within your environment. If you have any questions about extra rows of data in Power BI results, please contact me @GarthMJ.
